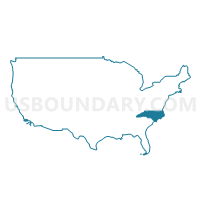
North Carolina
About
Outline

Summary
| Unique Area Identifier | 201787 |
| Name | North Carolina |
| Area (square miles) | 53,819.16 |
| Land Area (square miles) | 48,617.90 |
| Water Area (square miles) | 5,201.25 |
| % of Land Area | 90.34 |
| % of Water Area | 9.66 |
| Latitude of the Internal Point | 35.53971000 |
| Longtitude of the Internal Point | -79.13086360 |
| Total Population | 9,535,483 |
| Total Housing Units | 4,327,528 |
| Total Households | 3,745,155 |
| Median Age | 37.4 |
Maps
Graphs
Select a template below for downloading or customizing gragh for North Carolina


Neighbors
Neighoring State and Equivalent (by Name) Neighboring State and Equivalent on the Map
County in North Carolina (by Name) Neighboring County on the Map
- Alamance County, NC
- Alexander County, NC
- Alleghany County, NC
- Anson County, NC
- Ashe County, NC
- Avery County, NC
- Beaufort County, NC
- Bertie County, NC
- Bladen County, NC
- Brunswick County, NC
- Buncombe County, NC
- Burke County, NC
- Cabarrus County, NC
- Caldwell County, NC
- Camden County, NC
- Carteret County, NC
- Caswell County, NC
- Catawba County, NC
- Chatham County, NC
- Cherokee County, NC
- Chowan County, NC
- Clay County, NC
- Cleveland County, NC
- Columbus County, NC
- Craven County, NC
- Cumberland County, NC
- Currituck County, NC
- Dare County, NC
- Davidson County, NC
- Davie County, NC
- Duplin County, NC
- Durham County, NC
- Edgecombe County, NC
- Forsyth County, NC
- Franklin County, NC
- Gaston County, NC
- Gates County, NC
- Graham County, NC
- Granville County, NC
- Greene County, NC
- Guilford County, NC
- Halifax County, NC
- Harnett County, NC
- Haywood County, NC
- Henderson County, NC
- Hertford County, NC
- Hoke County, NC
- Hyde County, NC
- Iredell County, NC
- Jackson County, NC
- Johnston County, NC
- Jones County, NC
- Lee County, NC
- Lenoir County, NC
- Lincoln County, NC
- Macon County, NC
- Madison County, NC
- Martin County, NC
- McDowell County, NC
- Mecklenburg County, NC
- Mitchell County, NC
- Montgomery County, NC
- Moore County, NC
- Nash County, NC
- New Hanover County, NC
- Northampton County, NC
- Onslow County, NC
- Orange County, NC
- Pamlico County, NC
- Pasquotank County, NC
- Pender County, NC
- Perquimans County, NC
- Person County, NC
- Pitt County, NC
- Polk County, NC
- Randolph County, NC
- Richmond County, NC
- Robeson County, NC
- Rockingham County, NC
- Rowan County, NC
- Rutherford County, NC
- Sampson County, NC
- Scotland County, NC
- Stanly County, NC
- Stokes County, NC
- Surry County, NC
- Swain County, NC
- Transylvania County, NC
- Tyrrell County, NC
- Union County, NC
- Vance County, NC
- Wake County, NC
- Warren County, NC
- Washington County, NC
- Watauga County, NC
- Wayne County, NC
- Wilkes County, NC
- Wilson County, NC
- Yadkin County, NC
- Yancey County, NC
Top 10 County Subdivision in North Carolina (by Population) Neighboring County Subdivision on the Map
- Township 1, Charlotte, Mecklenburg County, NC (731,424)
- Winston township, Forsyth County, NC (229,617)
- Morehead township, Guilford County, NC (195,218)
- Raleigh township, Wake County, NC (117,838)
- Wilmington township, New Hanover County, NC (106,476)
- Durham township, Durham County, NC (106,210)
- Cleveland, Cleveland County, NC (98,078)
- Seventy-First township, Cumberland County, NC (93,772)
- Triangle township, Durham County, NC (93,373)
- Chapel Hill township, Orange County, NC (87,971)
Top 10 Place in North Carolina (by Population) Neighboring Place on the Map
- Charlotte city, NC (731,424)
- Raleigh city, NC (403,892)
- Greensboro city, NC (269,666)
- Winston-Salem city, NC (229,617)
- Durham city, NC (228,330)
- Fayetteville city, NC (200,564)
- Cary town, NC (135,234)
- Wilmington city, NC (106,476)
- High Point city, NC (104,371)
- Greenville city, NC (84,554)
Top 10 Unified School District in North Carolina (by Population) Neighboring Unified School District on the Map
- Charlotte-Mecklenburg Schools, NC (919,628)
- Wake County Schools, NC (900,993)
- Guilford County Schools, NC (488,406)
- Forsyth County Schools, NC (350,670)
- Cumberland County Schools, NC (297,793)
- Durham Public Schools, NC (267,587)
- Gaston County Schools, NC (206,086)
- New Hanover County Schools, NC (202,667)
- Union County Public Schools, NC (201,292)
- Buncombe County Schools, NC (199,157)
Top 10 State Legislative District Lower Chamber in North Carolina (by Population) Neighboring State Legislative District Lower Chamber on the Map
- State House District 68, NC (140,076)
- State House District 41, NC (129,780)
- State House District 37, NC (129,250)
- State House District 98, NC (125,672)
- State House District 40, NC (125,208)
- State House District 99, NC (112,312)
- State House District 105, NC (106,109)
- State House District 39, NC (104,910)
- State House District 26, NC (95,937)
- State House District 95, NC (94,835)
Top 10 State Legislative District Upper Chamber in North Carolina (by Population) Neighboring State Legislative District Upper Chamber on the Map
- State Senate District 35, NC (249,030)
- State Senate District 17, NC (246,945)
- State Senate District 40, NC (245,233)
- State Senate District 38, NC (238,282)
- State Senate District 14, NC (232,514)
- State Senate District 16, NC (220,672)
- State Senate District 8, NC (217,746)
- State Senate District 36, NC (210,610)
- State Senate District 12, NC (210,500)
- State Senate District 39, NC (208,922)
Top 10 111th Congressional District in North Carolina (by Population) Neighboring 111th Congressional District on the Map
- Congressional District 9, NC (852,377)
- Congressional District 4, NC (826,878)
- Congressional District 13, NC (753,104)
- Congressional District 7, NC (742,938)
- Congressional District 2, NC (741,576)
- Congressional District 12, NC (736,346)
- Congressional District 3, NC (735,979)
- Congressional District 6, NC (714,412)
- Congressional District 8, NC (709,449)
- Congressional District 11, NC (703,606)
Top 10 Census Tract in North Carolina (by Population) Neighboring Census Tract on the Map
- Census Tract 402.03, Johnston County, NC (14,249)
- Census Tract 528.06, Wake County, NC (13,750)
- Census Tract 13, Onslow County, NC (12,779)
- Census Tract 411.03, Johnston County, NC (12,699)
- Census Tract 540.14, Wake County, NC (12,342)
- Census Tract 540.13, Wake County, NC (12,070)
- Census Tract 405, Cabarrus County, NC (11,911)
- Census Tract 541.05, Wake County, NC (11,713)
- Census Tract 32.01, Cumberland County, NC (11,431)
- Census Tract 121.05, New Hanover County, NC (11,361)
Top 10 5-Digit ZIP Code Tabulation Area in North Carolina (by Population) Neighboring 5-Digit ZIP Code Tabulation Area on the Map
- 28269, NC (71,048)
- 27610, NC (65,648)
- 28277, NC (59,664)
- 27406, NC (56,458)
- 27858, NC (55,781)
- 28027, NC (55,435)
- 28655, NC (54,996)
- 28314, NC (54,520)
- 28215, NC (53,629)
- 27587, NC (53,078)
Data
Demographic, Population, Households, and Housing Units
** Data sources from census 2010 **
Show Data on Map
Download Full List as CSV
Download Quick Sheet as CSV
| Subject | This Area | National |
|---|---|---|
| POPULATION | ||
| Total Population Map | 9,535,483 | 308,745,538 |
| POPULATION, HISPANIC OR LATINO ORIGIN | ||
| Not Hispanic or Latino Map | 8,735,363 | 258,267,944 |
| Hispanic or Latino Map | 800,120 | 50,477,594 |
| POPULATION, RACE | ||
| White alone Map | 6,528,950 | 223,553,265 |
| Black or African American alone Map | 2,048,628 | 38,929,319 |
| American Indian and Alaska Native alone Map | 122,110 | 2,932,248 |
| Asian alone Map | 208,962 | 14,674,252 |
| Native Hawaiian and Other Pacific Islander alone Map | 6,604 | 540,013 |
| Some Other Race alone Map | 414,030 | 19,107,368 |
| Two or More Races Map | 206,199 | 9,009,073 |
| POPULATION, SEX | ||
| Male Map | 4,645,492 | 151,781,326 |
| Female Map | 4,889,991 | 156,964,212 |
| POPULATION, AGE (18 YEARS) | ||
| 18 years and over Map | 7,253,848 | 234,564,071 |
| Under 18 years | 2,281,635 | 74,181,467 |
| POPULATION, AGE | ||
| Under 5 years | 632,040 | 20,201,362 |
| 5 to 9 years | 635,945 | 20,348,657 |
| 10 to 14 years | 631,104 | 20,677,194 |
| 15 to 17 years | 382,546 | 12,954,254 |
| 18 and 19 years | 277,045 | 9,086,089 |
| 20 years | 141,076 | 4,519,129 |
| 21 years | 136,169 | 4,354,294 |
| 22 to 24 years | 384,328 | 12,712,576 |
| 25 to 29 years | 627,036 | 21,101,849 |
| 30 to 34 years | 619,557 | 19,962,099 |
| 35 to 39 years | 659,843 | 20,179,642 |
| 40 to 44 years | 667,308 | 20,890,964 |
| 45 to 49 years | 698,753 | 22,708,591 |
| 50 to 54 years | 669,893 | 22,298,125 |
| 55 to 59 years | 600,722 | 19,664,805 |
| 60 and 61 years | 222,924 | 7,113,727 |
| 62 to 64 years | 315,115 | 9,704,197 |
| 65 and 66 years | 172,919 | 5,319,902 |
| 67 to 69 years | 230,105 | 7,115,361 |
| 70 to 74 years | 294,543 | 9,278,166 |
| 75 to 79 years | 223,655 | 7,317,795 |
| 80 to 84 years | 165,396 | 5,743,327 |
| 85 years and over | 147,461 | 5,493,433 |
| MEDIAN AGE BY SEX | ||
| Both sexes Map | 37.40 | 37.20 |
| Male Map | 36.00 | 35.80 |
| Female Map | 38.70 | 38.50 |
| HOUSEHOLDS | ||
| Total Households Map | 3,745,155 | 116,716,292 |
| HOUSEHOLDS, HOUSEHOLD TYPE | ||
| Family households: Map | 2,499,174 | 77,538,296 |
| Husband-wife family Map | 1,812,029 | 56,510,377 |
| Other family: Map | 687,145 | 21,027,919 |
| Male householder, no wife present Map | 173,010 | 5,777,570 |
| Female householder, no husband present Map | 514,135 | 15,250,349 |
| Nonfamily households: Map | 1,245,981 | 39,177,996 |
| Householder living alone Map | 1,011,348 | 31,204,909 |
| Householder not living alone Map | 234,633 | 7,973,087 |
| HOUSEHOLDS, HISPANIC OR LATINO ORIGIN OF HOUSEHOLDER | ||
| Not Hispanic or Latino householder: Map | 3,543,727 | 103,254,926 |
| Hispanic or Latino householder: Map | 201,428 | 13,461,366 |
| HOUSEHOLDS, RACE OF HOUSEHOLDER | ||
| Householder who is White alone | 2,704,474 | 89,754,352 |
| Householder who is Black or African American alone | 782,121 | 14,129,983 |
| Householder who is American Indian and Alaska Native alone | 42,897 | 939,707 |
| Householder who is Asian alone | 64,158 | 4,632,164 |
| Householder who is Native Hawaiian and Other Pacific Islander alone | 2,003 | 143,932 |
| Householder who is Some Other Race alone | 102,073 | 4,916,427 |
| Householder who is Two or More Races | 47,429 | 2,199,727 |
| HOUSEHOLDS, HOUSEHOLD TYPE BY HOUSEHOLD SIZE | ||
| Family households: Map | 2,499,174 | 77,538,296 |
| 2-person household Map | 1,099,222 | 31,882,616 |
| 3-person household Map | 597,995 | 17,765,829 |
| 4-person household Map | 475,037 | 15,214,075 |
| 5-person household Map | 206,469 | 7,411,997 |
| 6-person household Map | 75,600 | 3,026,278 |
| 7-or-more-person household Map | 44,851 | 2,237,501 |
| Nonfamily households: Map | 1,245,981 | 39,177,996 |
| 1-person household Map | 1,011,348 | 31,204,909 |
| 2-person household Map | 188,712 | 6,360,012 |
| 3-person household Map | 29,440 | 992,156 |
| 4-person household Map | 11,932 | 411,171 |
| 5-person household Map | 2,848 | 126,634 |
| 6-person household Map | 1,042 | 48,421 |
| 7-or-more-person household Map | 659 | 34,693 |
| HOUSING UNITS | ||
| Total Housing Units Map | 4,327,528 | 131,704,730 |
| HOUSING UNITS, OCCUPANCY STATUS | ||
| Occupied Map | 3,745,155 | 116,716,292 |
| Vacant Map | 582,373 | 14,988,438 |
| HOUSING UNITS, OCCUPIED, TENURE | ||
| Owned with a mortgage or a loan Map | 1,741,905 | 52,979,430 |
| Owned free and clear Map | 755,995 | 23,006,644 |
| Renter occupied Map | 1,247,255 | 40,730,218 |
| HOUSING UNITS, VACANT, VACANCY STATUS | ||
| For rent Map | 156,587 | 4,137,567 |
| Rented, not occupied Map | 6,671 | 206,825 |
| For sale only Map | 71,693 | 1,896,796 |
| Sold, not occupied Map | 14,510 | 421,032 |
| For seasonal, recreational, or occasional use Map | 191,508 | 4,649,298 |
| For migrant workers Map | 1,620 | 24,161 |
| Other vacant Map | 139,784 | 3,652,759 |
| HOUSING UNITS, OCCUPIED, AVERAGE HOUSEHOLD SIZE BY TENURE | ||
| Total: Map | 2.48 | 2.58 |
| Owner occupied Map | 2.52 | 2.65 |
| Renter occupied Map | 2.40 | 2.44 |
| HOUSING UNITS, OCCUPIED, TENURE BY RACE OF HOUSEHOLDER | ||
| Owner occupied: Map | 2,497,900 | 75,986,074 |
| Householder who is White alone Map | 1,988,231 | 63,446,275 |
| Householder who is Black or African American alone Map | 380,844 | 6,261,464 |
| Householder who is American Indian and Alaska Native alone Map | 27,969 | 509,588 |
| Householder who is Asian alone Map | 38,608 | 2,688,861 |
| Householder who is Native Hawaiian and Other Pacific Islander alone Map | 858 | 61,911 |
| Householder who is Some Other Race alone Map | 38,578 | 1,975,817 |
| Householder who is Two or More Races Map | 22,812 | 1,042,158 |
| Renter occupied: Map | 1,247,255 | 40,730,218 |
| Householder who is White alone Map | 716,243 | 26,308,077 |
| Householder who is Black or African American alone Map | 401,277 | 7,868,519 |
| Householder who is American Indian and Alaska Native alone Map | 14,928 | 430,119 |
| Householder who is Asian alone Map | 25,550 | 1,943,303 |
| Householder who is Native Hawaiian and Other Pacific Islander alone Map | 1,145 | 82,021 |
| Householder who is Some Other Race alone Map | 63,495 | 2,940,610 |
| Householder who is Two or More Races Map | 24,617 | 1,157,569 |
| HOUSING UNITS, OCCUPIED, TENURE BY HISPANIC OR LATINO ORIGIN OF HOUSEHOLDER | ||
| Owner occupied: Map | 2,497,900 | 75,986,074 |
| Not Hispanic or Latino householder Map | 2,411,517 | 69,617,625 |
| Hispanic or Latino householder Map | 86,383 | 6,368,449 |
| Renter occupied: Map | 1,247,255 | 40,730,218 |
| Not Hispanic or Latino householder Map | 1,132,210 | 33,637,301 |
| Hispanic or Latino householder Map | 115,045 | 7,092,917 |
| HOUSING UNITS, OCCUPIED, TENURE BY HOUSEHOLD SIZE | ||
| Owner occupied: Map | 2,497,900 | 75,986,074 |
| 1-person household Map | 567,073 | 16,453,569 |
| 2-person household Map | 951,836 | 27,618,605 |
| 3-person household Map | 424,704 | 12,517,563 |
| 4-person household Map | 343,576 | 10,998,793 |
| 5-person household Map | 138,065 | 5,057,765 |
| 6-person household Map | 47,014 | 1,965,796 |
| 7-or-more-person household Map | 25,632 | 1,373,983 |
| Renter occupied: Map | 1,247,255 | 40,730,218 |
| 1-person household Map | 444,275 | 14,751,340 |
| 2-person household Map | 336,098 | 10,624,023 |
| 3-person household Map | 202,731 | 6,240,422 |
| 4-person household Map | 143,393 | 4,626,453 |
| 5-person household Map | 71,252 | 2,480,866 |
| 6-person household Map | 29,628 | 1,108,903 |
| 7-or-more-person household Map | 19,878 | 898,211 |
Loading...


